The Monetary Unit Sampling Example illustrates an essential technique in auditing, showcasing how auditors can enhance the precision of financial statement audits. This blog post will guide you through a practical example of Monetary Unit Sampling, highlighting its importance and effectiveness in identifying potential misstatements. By understanding this example, auditors can better grasp the application of this method, ensuring a more efficient and accurate audit outcome. Let’s explore the steps and insights gained from applying Monetary Unit Sampling in real-world auditing.
Monetary Unit Sampling in Definition
Monetary Unit Sampling (MUS) is a statistical sampling method used in auditing to estimate the amount by which an account balance is in error. The method involves specifying a confidence level, tolerable error, and an estimate of likely error to determine the appropriate sample size. It is a form of probability-proportional-to-size sampling, where each dollar in the population has an equal chance of being selected for testing. The technique involves selecting a sample of monetary units (for example, dollars) from the population and using the results to draw inferences about the entire population.
The term probability-proportional-to-size means the bigger the line item, the bigger its chance of being picked for testing. This will make the auditor love the technique because the bigger the line item, the bigger the auditor’s skepticism about its trueness. Another benefit of MUS is that it will make it easier for you to fulfill the audit scope with fewer resources and complications.
For a clearer understanding of the MUS definition, hopefully, please read here.
Preparing for a Monetary Unit Sampling Audit
Before jumping into the audit using MUS, you must fulfill the requisites, as shown below.
- Define the Audit Objectives: Identify your aim with the MUS. This could be verifying account balance accuracy, testing internal controls’ effectiveness, or both.
- Determine the Population: Specify the set of data to which MUS will be applied. This could be the total value of sales invoices, accounts receivable, or any other financial account relevant to the audit objectives.
- Select the Confidence Level: Decide on the confidence level you need for the audit findings. A higher confidence level increases the reliability of the audit conclusions but may require a larger sample size. When using MUS, choosing the confidence level automatically sets up the risk of incorrect acceptance, as discussed.
- Estimate the Expected Misstatement and Tolerable Misstatement: Based on prior audits or preliminary tests, estimate the expected misstatement in the population and define what level of misstatement is tolerable.
- Determine the Risk of Incorrect Acceptance.
Because we will elaborate on the example of the uses of Monetary Unit Sampling in an audit, we also need to answer the above questions. Here are our answers.
Completing the requisites for the example
- The audit objectives are to verify sales transaction accuracy.
- Population: sales in 2014 from a company named AdventureWorks, with a total amount of 20,057,928.81.
- Confidence level: 95%.
- Risk of Incorrect Acceptance (RIA): 5%; this value directly correlates to the confidence level. Thus, if the confidence level is 95%, RIA’s value is 5% (100%-95%).
- Expected Misstatement: 2%.
- Tolerable Misstatement: 5%.
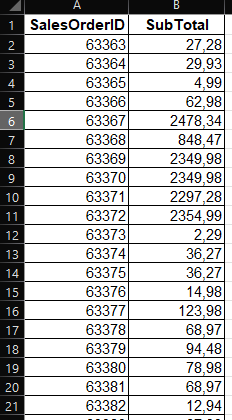
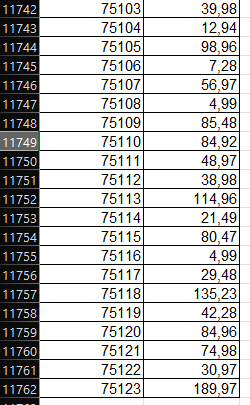
This time, you’ll use AdventureWorks data, a fictional company that manufactures metal and composite bicycles for sale to commercial distributors in North America, Europe, and Asia. Originally, there were several tables on the said data, but you’ll use only the SalesOrderHeader‘s data because the audit objective is to assess the sales’ accuracy. From the table, you’ll pick the columns of SalesOrderID and SubTotal, as shown below.
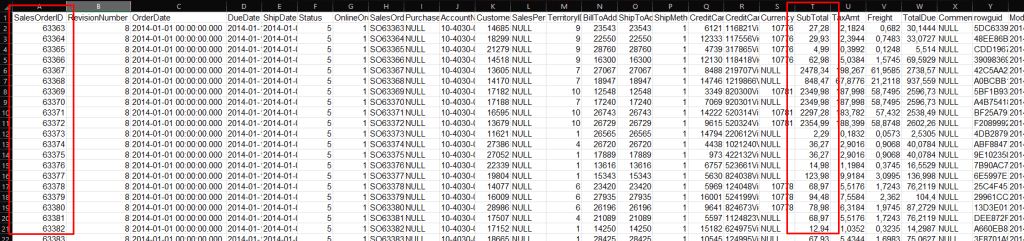
You can download the complete table, as shown previously, here. After ditching the other columns, you’ll work with two columns, totaling 11,761 rows, with a total amount of 20,057,928.81. If you want to follow this post, consider downloading the data here.
Determining the Sample Size
After getting the data, determining the sample size is your next challenge. There are several methods for the task, but this time, for the sake of simplicity, you’ll use The Table Approach.
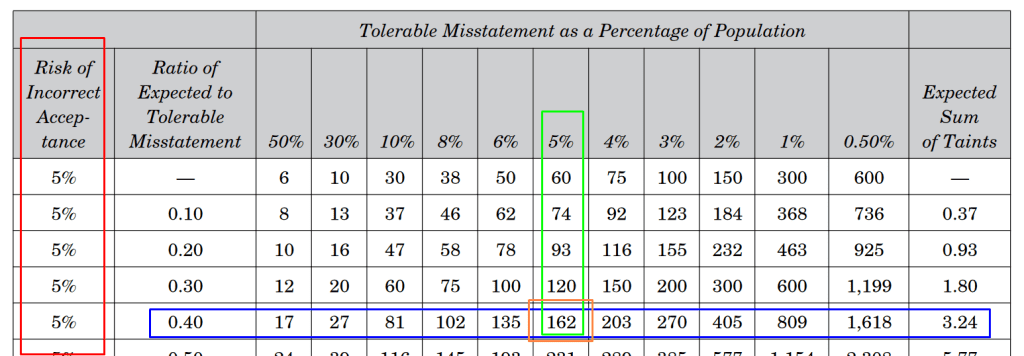
You can directly pull the sample size using the AICPA’s Table C-1 Monetary Unit Sample Size Determination Tables. You need three parameters to operate the table.
- RIA
- The ratio of Expected to Tolerable Misstatement
- Tolerable Misstatement as a Percentage of Population
In our example, the ratio of Expected to Tolerable Misstatement is 0.4 (2%/5%). RIA is set at 5%, and then Tolerable Misstatement is set at 5%. Pointing the table using previous parameters, you get 162 as the sample size.
Picking Samples
After getting the sample size, the next step is to pick the 162 samples out of 11761 data. Again, there are a couple of methods for the step, but you are a little busy today, so you choose the simplest one, Simple Random Sampling. This means you generate a random number for 162 times.
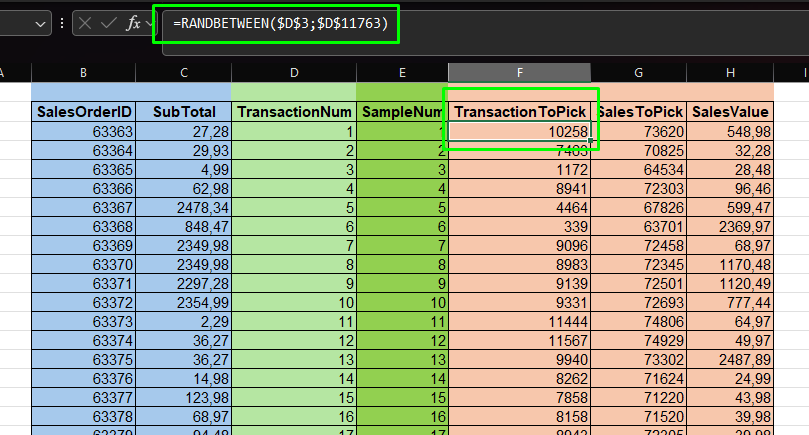
Applying the method in MS Excel is relatively simple. In short, you’ll employ the RANDBETWEEN function. But first, add the sequential number for each row, from 1 to the last data, which is 11761. This column (TransactionNum column in the pictures) is an identifier for each transaction, which will be employed in the next step. Next, add sequential numbers from 1 to 162; this is the sample identifier.
In the next column (TransactionToPick), you generate a random number between 1 and 11761 using the RANDBETWEEN function in Excel. Copy the formula for every SampleNum, so you have 162 random numbers. Limiting the random number generated between particular scopes, in this case, the maximum number of population rows is essential because you should pick a transaction among the population.
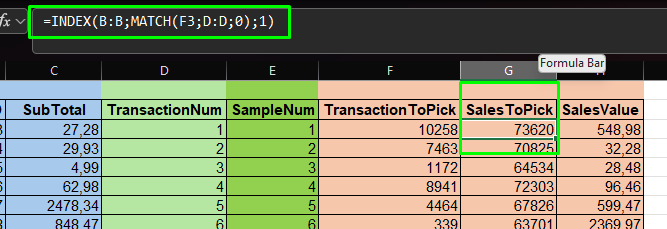
=RANDBETWEEN($D$3;$D$11763)The next column (SalesToPick) is filled with SalesOrderID, which refers to a random number from the previous step. To achieve this, the INDEX and MATCH functions are used.
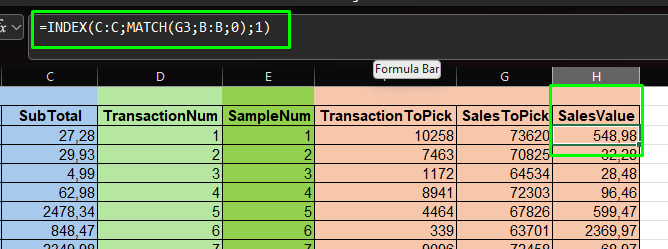
=INDEX(B:B;MATCH(F3;D:D;0);1)After getting the SalesOrderID for each sample, you want to know how much dollar each transaction has. This data is what you’ll verify the accuracy of the value through audit procedures. To get the data, you will again use INDEX and MATCH with proper columns to refer to.
=INDEX(C:C;MATCH(G3;B:B;0);1)Excel keeps changing the random number every time it calculates the sheets, as elaborated here and there. To make it persistent, consider using copy and paste special – values for the data.
Analyzing the Results
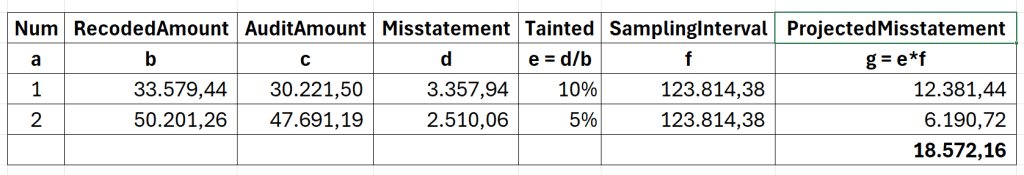
After going through blood and sweat doing audit procedures, you end up with two transactions that indicate the recorded balances were overstated. To extrapolate the misstatement. You’ll use the taint method, endorsed by the AICPA’s audit guide, audit sampling.
Your audit procedures for the two transactions reveal the misstatement, as shown below. The tainted value (column e) is a percentage of misstatement compared to the recorded amount. The percentage is then multiplied by the sampling interval (total population divided by the sample size) to get the projected misstatement.
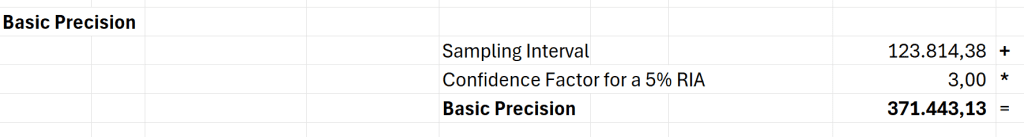
Then, you need to calculate the basic precision. It’s the upper misstatement limit value when no misstatement is found. It’s the default value when using the Monetary Unit Sampling. Because MUS is a statistical method, which always has some degree of uncertainty, you’ll always provide the “default misstatement” even if you find none.
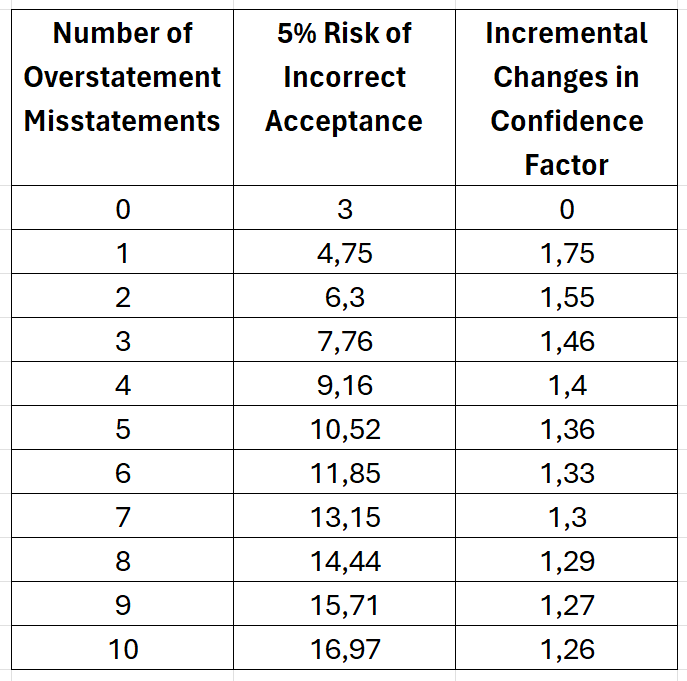
To calculate the basic precision, consult AICPA’s Table C-3, Monetary Unit Sampling-Confidence Factors for Sample Evaluation. Choose the value pointed by the zero number of overstatement misstatement and your RIA. In the example, if the RIA is 5% and no misstatement is found, you’ll get 3.00 as confidence factors.
Next, all misstatements should be sorted first, with the highest first. Then, you need to calculate the incremental allowance for each projected misstatement. Don’t forget to reduce the total incremental allowance with the projected misstatement, as shown below.
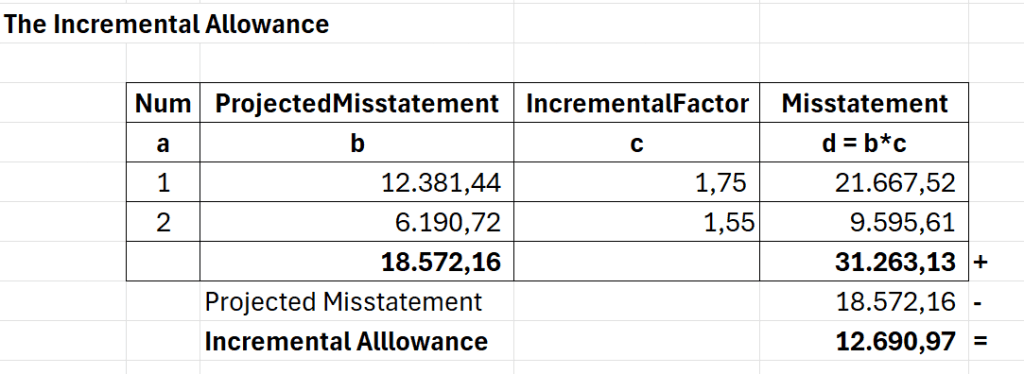
The incremental factor is the discrepancy between each row in AICPA’s Table C-3.
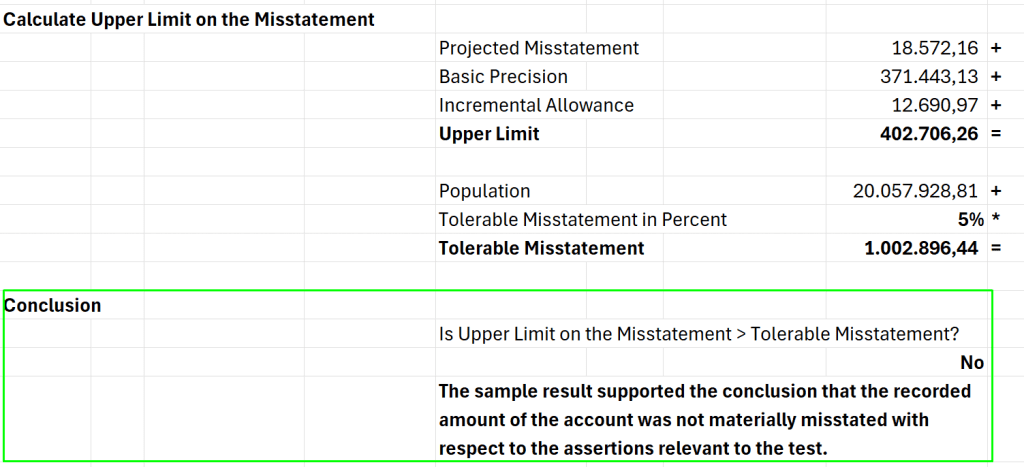
The last step, before getting a conclusion for your samples, is to calculate the upper limit on the misstatement—the goal was achieved by adding the projected misstatement, basic precision, and incremental allowance.
Comparing the upper limit on the misstatement and the tolerable misstatement, you can draw a conclusion for your audit. In this case, the sample result supported the conclusion that the recorded amount of the sales transactions wasn’t materially misstated. You found two misstatements, but based on the objective procedure (MUS), it doesn’t materially enough for you to modify the opinion.
Download the complete Excel here if you are interested.
Conclusion
The previous example has highlighted how Monetary Unit Sampling could improve your audit quality. By walking through the example, you’ve seen firsthand how MUS is a complete and objective tool that gives you a guide to performing the substantive test and the confidence to conclude the audit results.
Stay ahead in your auditing career by keeping up with the latest techniques and insights. Subscribe to our newsletter today and join a community committed to excellence in auditing. Don’t miss out on valuable updates that can elevate your audit strategies. Subscribe now and transform your approach with every article.
Images generated by Dall-E3.