Monetary Unit Sampling using Excel is necessary in today’s digital age. As we lean more into digital platforms, particularly for data storage, incorporating Monetary Unit Sampling into Excel is now pretty standard. In this blog post, we’ll break down the nitty-gritty of using Excel for Monetary Unit Sampling and offer some straightforward tips on how to nail it during an audit.
TL;DR
We discuss the fundamentals of Monetary Unit Sampling and its application in Ms. Excel and provide a step-by-step guide to streamline the audit process. Here is the process we cover.
- Determine the sample size.
- Select the sample items.
- Evaluate the sample results.
- Draw Conclusions.
For those interested, you can download the Excel file used in this post here.
Basic of Monetary Unit Sampling in Auditing
Monetary Unit Sampling (MUS) is a statistical sampling method, mainly to perform substantive testing, though it can be used for tests of control, too, in audits. At its core, individual monetary units (like dollars) is considered separate sampling unit.
The selection probability for each unit is directly proportional to its monetary value. So, a $10 item has twice the chance of being selected as a $5 item. This ensures that the items with the highest values (and potentially the highest risk) have the highest chance of being examined.
Another convenience feature we love about the MUS method is how it directly expresses the results in dollars. After examining your sample results, you can explicitly say, “The misstatement value is ten dollars, which is smaller than the tolerable misstatement, so we can conclude that blah blah blah.”
This post will explore a small project to give you a different angle about the method. We’ll be using Ms. Excel as we all know that Excel is the most used, maybe overly used, tool in finance, so it’s safe to assume that most auditors are fluent with the technology.
Why is Excel Important in Auditing?
Here are some benefits of using Ms. Excel in an audit engagement.
- Flexibility. Each client has unique characteristics. Excel allows you to tailor how the data input, which examination is performed, or how to present the data based on the client’s data.
- Data analysis. Excel provides many formulas, functions, and tools that help you analyze client data.
- Compatibility. Excel’s format is popular. Almost every system (such as an ERP system) has the ability to read (import) and write (export) data to Excel.
- Cost-Effectiveness. There are specialized audit software on the market. But often, Excel is a more cost-effective tool. I bet there is Excel installed in every auditor you meet.
- Documentation. Excel facilitates the organized preparation of working papers documenting audit procedures, evidence, and conclusions. Excel also offers a transparent audit trail for the sampling process, detailing steps, formulas, and adjustments.
- Standardization. Audit firms can create standardized Excel templates for various audit procedures, ensuring consistency between engagements.
- Sampling. Do you need to draw a sample from the data? Need to generate a random number for the sampling? No need to worry. Excel provides the RAND function to produce a random number. Even if you need a more sophisticated sampling method and Excel doesn’t provide it by default, you can always build your sampling system through Excel. As long as you know the mechanics behind the sampling method, you can give Excel the step-by-step, and Excel will do the math for you.
Based on the benefits in the previous section, it’s hard not to love Excel as our daily driver audit. Now, let’s add another reason to love the tool.
Step-by-Step Monetary Unit Sampling with Excel
Some sources (like AICPA and Whittington) say Monetary Unit Sampling is commonly used to test accounts receivable. And after scouring the internet, I found the IBM late payment histories’s dataset from Kaggle. Here’s the overview of the data.
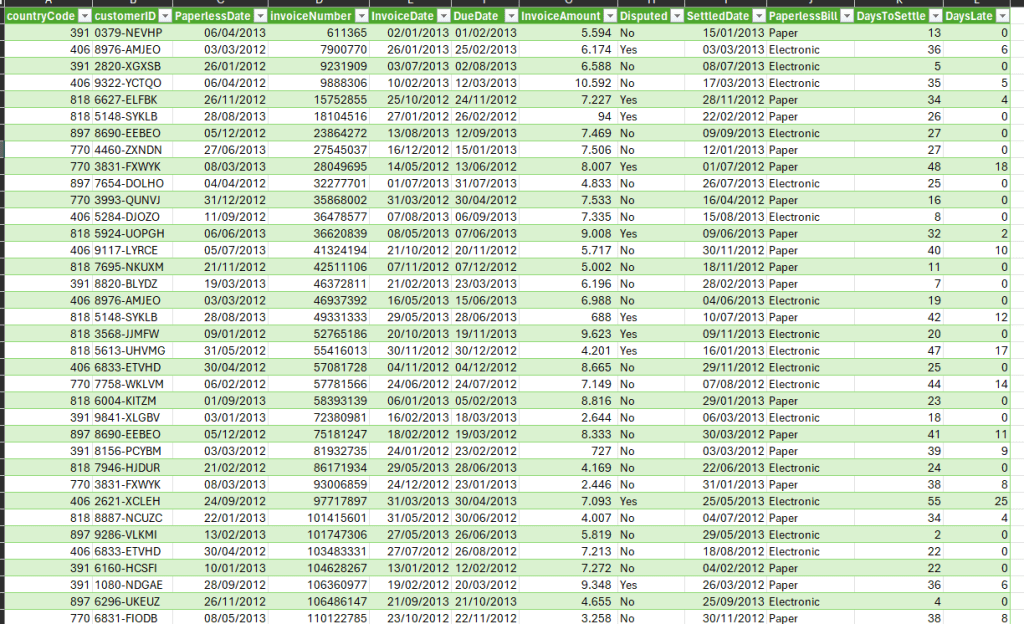
As you may see, the data contains sales data in 2012 and 2013, with the total data being 2466 rows. To make our small project more concise and compelling, we’ll slightly tweak the data to fit the following criteria.
- The sales became accounts receivable by the end of 2012.
- There are ten logical units/sales with overstatement.
- Those ten sales spread randomly across the population.
- The overstatement (on the ten sales) ranges between 50% to 100%.
After filtering the data and intentionally adding overstatements on ten sales, here’s our data. You can download the data here.
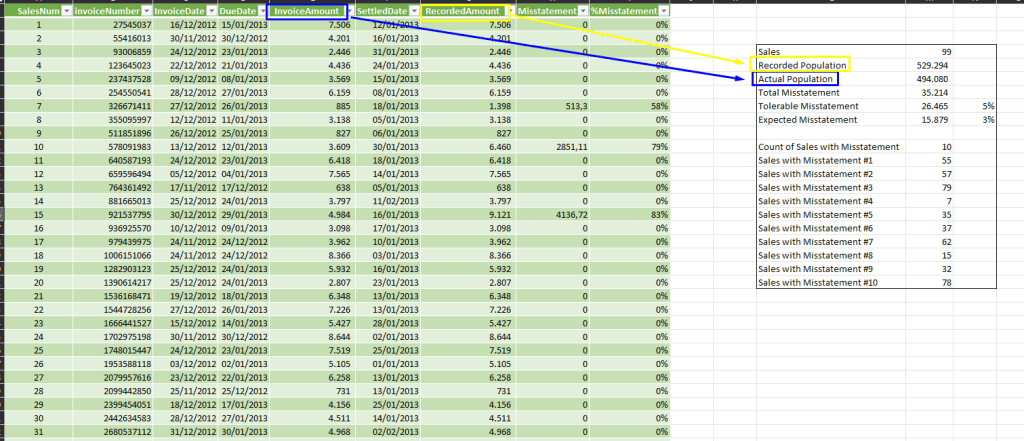
The actual sales are 494,080 dollars. After adding overstatement on ten sales, the recorded amount becomes 529,294. It’ll be interesting to see whether the following process could catch the misstatement.
Of course, in the real-world audit engagement, we don’t know the actual value of each transaction (that’s why we do the sampling stuff). We prepare the data with intentional mistakes to demonstrate that our method is solid enough to find the misstatements.
We also decided on the necessary variables, as shown below.
- Tolerable Misstatement: 5% of the Recorded Amount (26,465)
- Expected Misstatement: 3% of the Recorded Amount (15,879)
- Risk of Incorrect Acceptance (RIA): 5%
Determine the Sample Size
After deciding the objective of the audit test and the sampling method, Monetary Unit Sampling, the first thing to do is determine the sample size. You already know that there are several methods to determine the sample size.
You decide to use the confidence factor approach because you expect misstatement on the population, avoid the table approach, and the expected misstatement is more than 40% of tolerable misstatement.
Here’s how we calculate the sample size using the confidence factor approach.
Sample Size = (Population Size * Confidence Factor) / Tolerable Misstatement
You can use the following figures to fill the equation.
- Population Size: 529,294
- Confidence Factor: 17.85
We can use Table C-2 from Appendix C of the AICPA Audit Sampling Guide to get the Confidence Factor.
Sample Size = 529,294 * 17.85 / 26,465 = 356.9 = 357
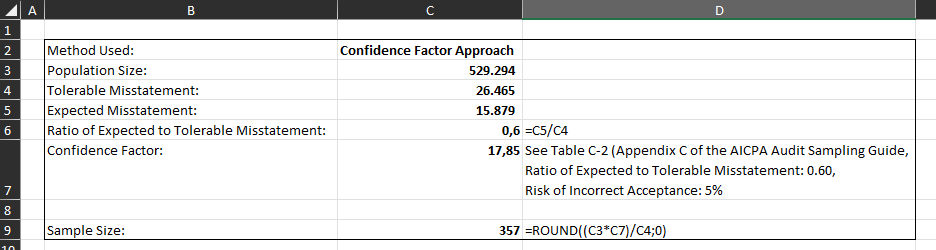
You’ll need to pick 357 samples from the population.
At first, it seems counterintuitive because there are only 99 accounts receivable transactions, but the method aims for 357 samples. However, that’s how Monetary Unit Sampling works; it doesn’t use transactions as a sampling unit, but every dollar is the sampling unit. So, in short, we’ll pick 357 dollars as a sample.
Select the Sample Items
There are several sampling selection methods. This time, we’ll use Cell Sampling. We already covered the topic here.
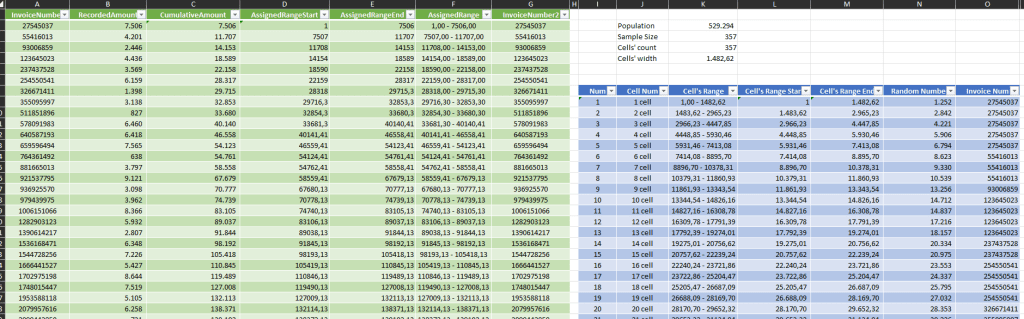
In summary, the population (529,294) is divided into multiple cells. The cells itself is the same number as the samples (357). Each cell has a width, and we can get this variable by dividing the population by the sample size.
We only need two columns for the calculation: Invoice Number and Recorded Amount. Here’s a quick step-by-step what we need to do.
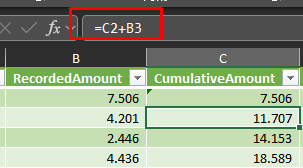
Add cumulative amount
For the first row, the cumulative amount is the Recorded Amount’s value. Add the former cumulative amount with the current recorded amount for the next row.
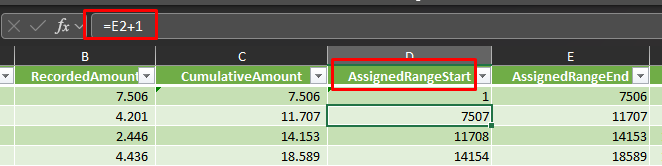
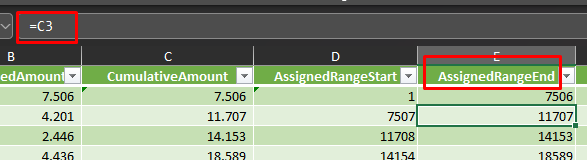
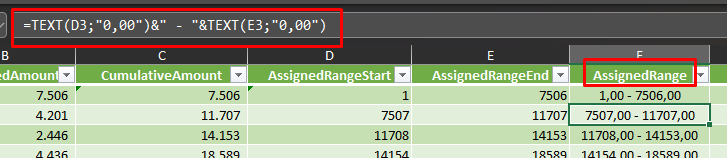
Add assigned range
Each transaction needs to be assigned with the dollar range with regard to its value.
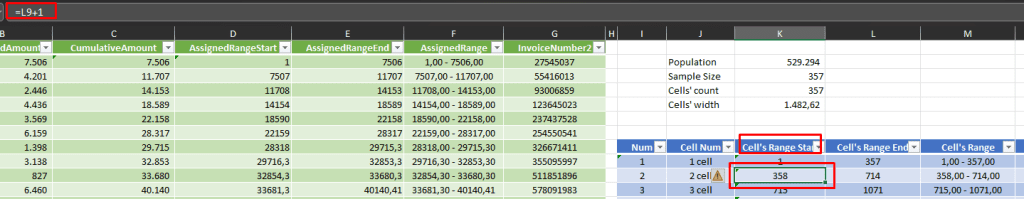
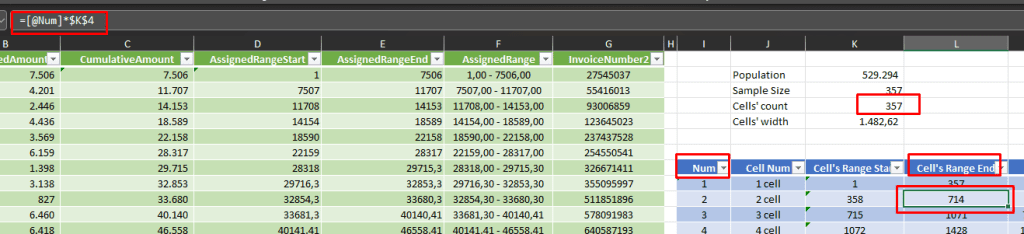
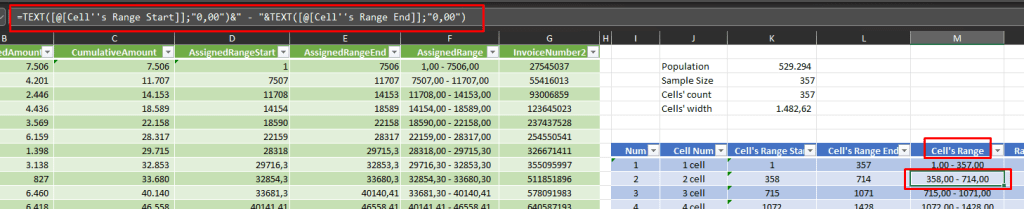
Add cell’s range
Each cell assigned with a range. Here’s how to do the task on Excel.
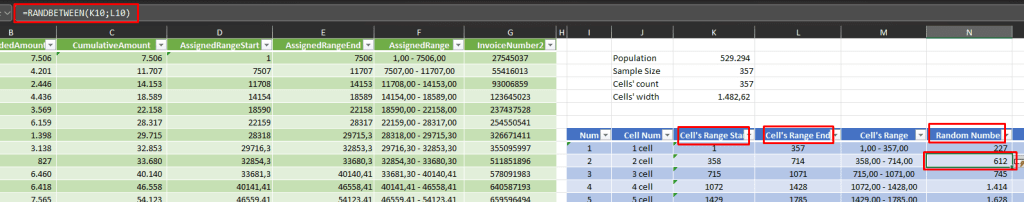
Draw a random number for each cell
Based on the cell’s range start column and cell’s range end column we can ask the RANDBETWEEN function to generate a random number.
One thing to note. Excel RANDBETWEEN function result change for any operation on the worksheet. So, if you want a permanent number, you need to generate the random numbers once and then save them as values for the next process.
Get Invoice Number referred by random numbers
I found Excel VLOOKUP comes in handy for the job. Use the random number column to refer to the assigned range start column to get the Invoice Number.
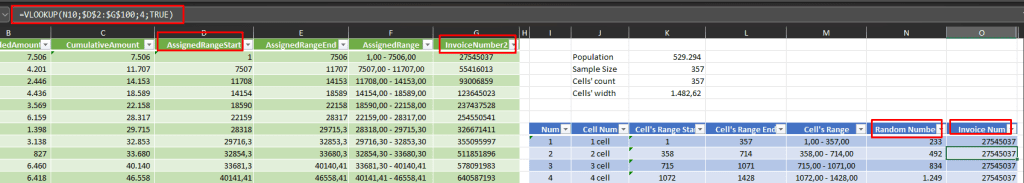
As you may see from the image above, several cells refer to the same Invoice Number. Consequently, you need to remove the duplicate invoice number and get the unique one.
Get unique Invoice Number as samples
For me, the fastest way to tear off the duplicate numbers is using the Remove Duplicates function from the Data menu.
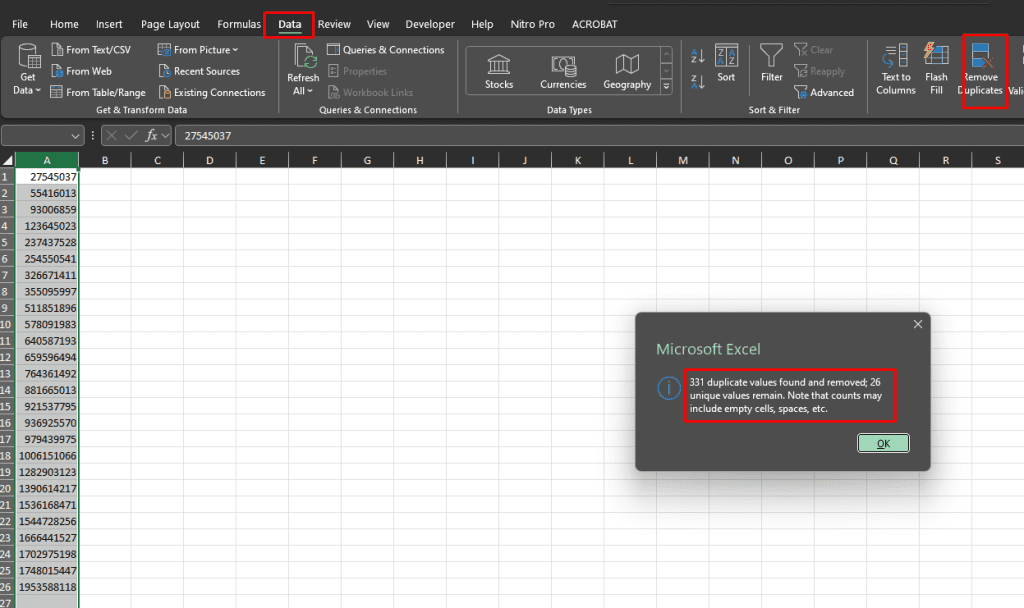
This time, the process give us 26 transactions to examine. Perform a test for 26 out of 99 transactions, a relatively moderate number. Not too much, but not too little too.
Evaluate the Sample Result
After performing the substantive test, you’ve found the following results. Yes, you catch three misstatements we planted before. The misstatement column results from the recorded amount column subtracted from the audit amount column.
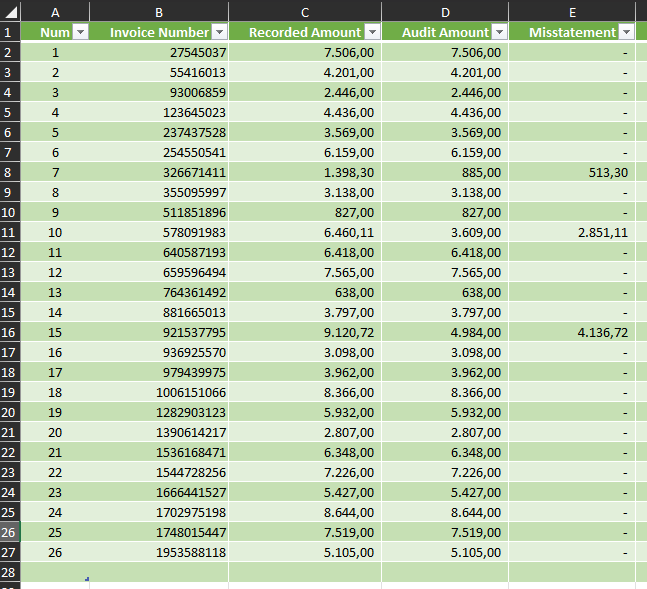
To calculate the error, you’ll use the taint method (the misstatement divided by the recorded amount). Then, you calculate the Upper Misstatement Limit and compare the number with the Tolerable Misstatement to conclude the sample to the population. In summary, the conclusion could be:
- Upper Misstatement Limit < Tolerable Misstatement = The sample supports the conclusion that the population misstatement is within the acceptable limit.
- Upper Misstatement Limit > Tolerable Misstatement = The sample findings do not provide sufficient evidence to conclude that the population’s misstatement is within the acceptable threshold.
The Upper Misstatement Limit’s formula is shown below.
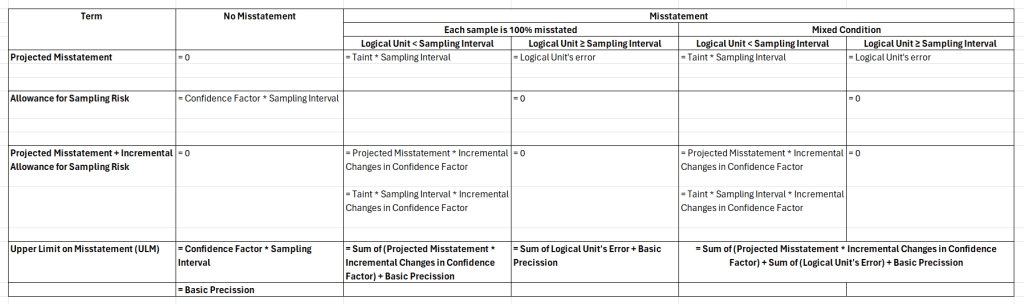
Since you found misstatements in the sample, but each sample is not 100% misstated, you’ll employ the mixed condition formula. First, let’s calculate the basic precision.
Basic Precision
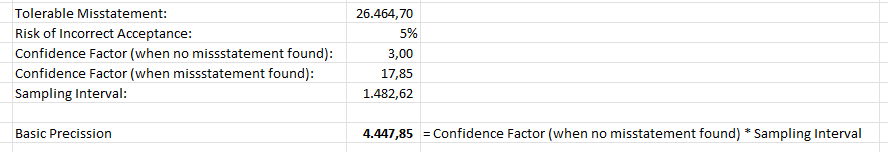
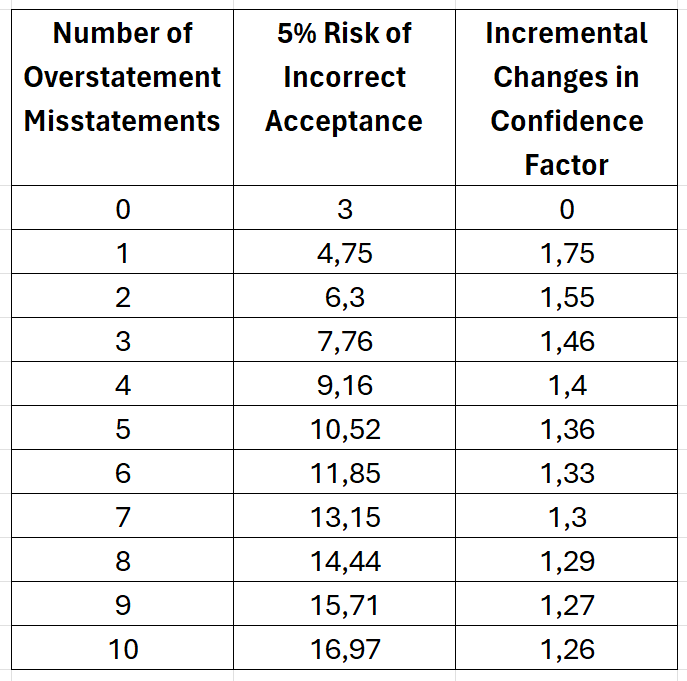
The confidence factor (3.00) is pulled from AICPA’s Table C-3, as pointed out by the zero number of overstatements and 5% Risk of Incorrect Acceptance.
When you discover a misstatement in the sample, it’s crucial to examine the recorded amount of the sample to determine if it falls within the sampling interval. This is essential because there are distinct methods to handle transactions below the sampling interval versus those exceeding it. Therefore, you need to filter the samples by their recorded amount.

Transaction Value < Sampling Interval
You should calculate the projected misstatement added with the incremental allowance for sampling risk for the sample below the sampling interval, as shown below.

The projected misstatement is the taint column multiplied by the sampling interval. Incremental changes in confidence factor gathered from the AICPA’s Table C-3. The last column results from the projected misstatement multiplied by the incremental changes in the confidence factor’s column.
Transaction Value > Sampling Interval
For samples greater than the sampling interval, the calculation is more straightforward. You can use the misstatement directly.
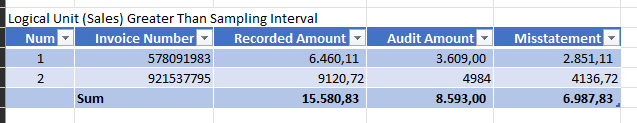
After collecting numbers from the basic precision and samples with misstatements, you could sum those three values and get the Upper Limit on Misstatement’s number, as shown below.
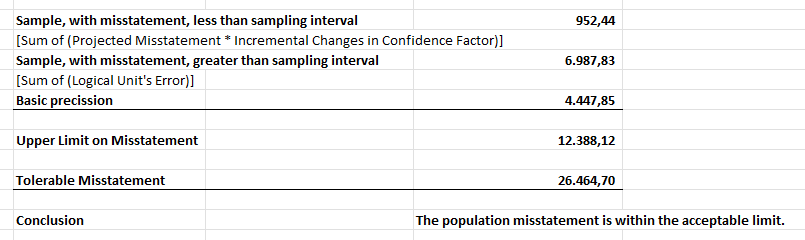
The Upper Limit on Misstatement’s value is 12,388.12, lower than the Tolerable Misstatement, which is 26.464,70. Thus, the conclusion will be “the population misstatement is within the acceptable limit.”
You might be surprised, especially knowing the actual misstatement value is 35,214, that the examination process didn’t catch the real misstatement. Unfortunately, there is always a sampling risk, the risk that the auditor’s conclusion based on a sample may be different from the conclusion if the entire population were examined.
One solution for reducing the sampling risk is to increase the sample size. Because a larger sample provides a more representative picture of the population. But that’s a discussion for another day.
Conclusion
An audit often means fighting with data. Ms. Excel, so far, is the go-to app for many auditors. It offers most of us flexibility, portability, and a cost-effective solution.
What are your most memorable aha moments with Excel? Please comment below.
Cheers.
Cover Images generated by Canva’s Text to Image App.

I really don’t know, how You choosed only 26 items to examine, especialy these are the 26 first invoices in population. I get 86-88 transactions in sample
Hi Tomasz. First, thank you for taking the time to read my article. I am very grateful for your interest and truly appreciate you trying the content. Have you deduped the invoice number? If you don’t mind, could you send the file you are working on so I can try to find the fix?