Is there any rule to follow for deciding the monetary unit sampling sample size? That might flash into your head before jumping into the data pool or doing the transaction testing. You may wonder how many samples you need when using the monetary unit sampling method. In this post, you’ll learn how to pick a sample size using Monetary Unit Sampling.
TL;DR
The Significance of Sample Size in Monetary Unit Sampling
As a refresher, Monetary Unit Sampling (MUS) is a statistical sampling method for substantive testing. Although an attribute sampling, MUS is expressed in dollar (or another currency) amount, which is more natural for the auditor to express. In the MUS realm, a population is the total recorded dollar in the account balance, and each dollar acts as a sampling unit. So, greater transaction values increase the chance of being selected as a sample, which, again, the auditor favors.
You should pick the correct sample size for a reliable and precise audit conclusion, especially when using a statistical method like Monetary Unit Sampling. On the other hand, you also must consider the effectiveness and efficiency of the substantive procedure.
Using a larger sample, you will have a higher level of confidence in the results and obtain a more reliable conclusion about the financial statement. Oppositely, a smaller sample size enhances the risk of incorrect acceptance and induces a less reliable audit conclusion. A large sample size is our yearning. But after considering the increased time, effort, and complexity, we snap back to reality. “Say no for a larger sample size.”
Key Factors Influencing Monetary Unit Sampling Sample Size
Before calculating the right sample size for Monetary Unit Sampling, it’s important to recognize the key factors affecting the sample size.
Population Size (PS)
In a general sense, a larger population requires a larger sample size, and vice versa. Especially when using Monetary Unit Sampling, population plays a crucial role in the sample size determination. As seen in the previous image in the TL;DR section, every method uses population size in the “equation.”
You can confirm the population size is an MVP player in the Monetary Unit Sampling world because it is used in several parts, such as selecting the sample and projecting the sample result.
Risk of Incorrect Acceptance (RIA)
This is the possibility that you conclude that the population is not materially misstated when it’s actually materially misstated. The risk is determined by the auditor after considering several factors, such as the audit objective, tolerable misstatement, and, you’ll like this one, your professional judgment.
If you prefer a more “mathy” way to assess RIA, Whittington provides an equation to calculate this risk. TD = AR / (IR * CR * AP). TD is the allowable risk of incorrect acceptance for the substantive test of details, and AP is the risk that analytical procedures and any other substantive procedures not using audit sampling will fail to detect a material misstatement.
When you specify a smaller allowance for sampling risk, in other words, reducing the risk of incorrect acceptance (RIA), the sample size will increase.
Tolerable Misstatement (TM)
This is a predetermined threshold you set based on professional judgment and serves as the maximum amount of misstatement you want to accept in the population without concluding that the financial statements are materially misstated.
If you set the higher tolerable misstatement, you are willing to accept a higher level of misstatement. So, the sample size will be smaller because you want to accept a higher level of risk.
Expected Misstatement (EM)
It’s the amount of misstatement you expect to exist in the population. Thus, the higher the expected misstatement value, the larger the sample size you need to obtain more precise information from the sample. Because a larger sample size could provide a higher probability of detecting the expected misstatement in the population.
How to Calculate Monetary Unit Sampling Sample Size?
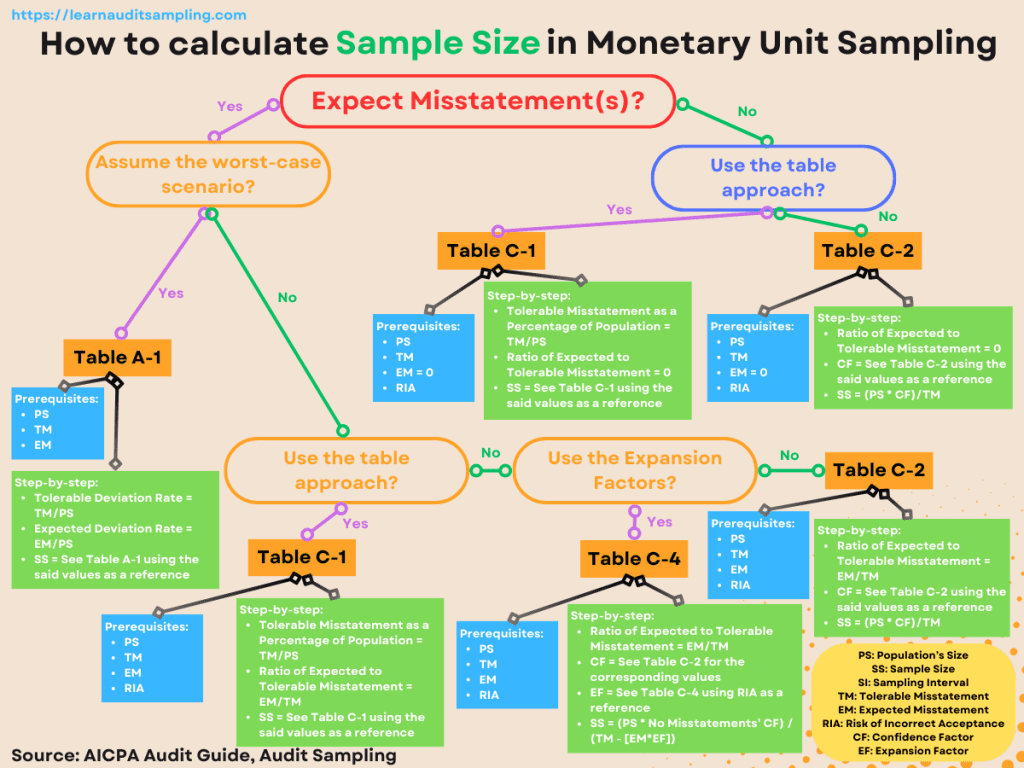
Now, you’ll see how those four key factors “work” together to determine the sample size. We’ll use two scenarios: when you expect no misstatement in the population and when you expect any misstatement.
For our examples in both scenarios, we’ll use the following values.
- Population Size (PS): 1,000,000
- Tolerable Misstatement (TM): 20,000
- Expected Misstatement (EM): 0 (When no misstatement is expected)
- Expected Misstatement (EM): 4,000 (When misstatement is expected)
- Risk of Incorrect Acceptance (RIA): 5%
All set up. Let’s dive in.
No Misstatement Expects
The table approach may be the “easiest” way to get the sample size. It can handle both scenarios when no misstatement is expected, and misstatement is expected. The following section will discuss utilizing the table approach when expecting no misstatement on the population.
The table approach
By table, I mean the AICPA Audit Sampling Guide table C-1. It’s the “easiest” way because you just need to pull the sample size from the table. The table, however, requires:
- Risk of Incorrect Acceptance (RIA)
- The ratio of Expected to Tolerable Misstatement
- Tolerable Misstatement as a Percentage of Population
We already had our RIA (5%). So, you must calculate the last two parameters for the table prerequisites. Here’s how.
Ratio of Expected to Tolerable Misstatement = EM/TM
EM/TM = 0/20,000 = 0
In this case, the ratio value is 0 because you expect no misstatement in the population (EM = 0). Next, you calculate the Tolerable Misstatement percentage using the equation below.
Tolerable Misstatement as a Percentage of Population = TM/PS
TM/PS = 20,000/1,000,000 = 2%
We got 2% as the TM percentage.
To summarize this section, here’s the prerequisite value for the table approach.
- Risk of Incorrect Acceptance (RIA) = 5%
- Ratio of Expected to Tolerable Misstatement = 0
- Tolerable Misstatement as a Percentage of Population = 2%
Using those three parameters in the table C-1, we will get a sample size of 150.
The Confidence Factor (CF) approach
There is another way to pick a sample size. You can use the confidence factor by dividing the Tolerable Misstatement (TM) by the confidence factor to get the sampling interval (SI). You’ll get the sample size by dividing the Population (PS) by the sampling interval.
SI = TM / CF
Sample Size = PS / SI = (PS * CF) / TM
How do we get the confidence factor?
By using AICPA table C-2.
The table expects two parameters: the Ratio of Expected to Tolerable Misstatement and the RIA. Since we already have the RIA, we compute the Ratio of Expected to tolerate misstatement using the equation below.
Ratio of Expected to Tolerable Misstatement = EM/TM
EM/TM = 0/20,000 = 0
Because we expect no misstatement, the ratio value is zero.
Plunging zero into the Ratio of Expected to Tolerable Misstatement and 5% RIA to the AICPA table C-2, we got a confidence factor 3.00. Then, we calculate the sample size.
Sample Size = (PS * CF) / TM = (1,000,000 * 3.00) / 20,000 = 150
We got the same number from the table approach, 150 as a sample size.
Misstatement Expects
Sometimes, the auditor expects misstatements in the population. To address such conditions, you can use the two methods we discussed earlier, plus there are another two methods we can employ to determine sample size when using the Monetary Unit Sampling.
The table approach
AICPA Audit Sampling Guide table C-1 is also useful when you expect misstatement in the population. In this case, you can fill all the three parameters needed with a number greater than zero, unlike the last time we used it.
- Risk of Incorrect Acceptance (RIA) = 5%
- The ratio of Expected to Tolerable Misstatement = EM/TM = 4,000/20,000 = 0.20
- Tolerable Misstatement as a Percentage of Population = 2,000/1,000,000 = 2%
Using those three values as a reference in AICPA table C-1, we will get a sample size of 232.
The Confidence Factor (CF) approach
Similar to the table approach, the confidence factor is also useful when you expect to find a misstatement in the population’s balance. We can use the below parameters to get the confidence factor in the AICPA table C-2.
- Risk of Incorrect Acceptance (RIA) = 5%
- Ratio of Expected to Tolerable Misstatement = EM/TM = 4,000/20,000 = 0.20
The confidence factor for the said parameters is 4.63. So, the sample size will be.
Sample Size = (PS * CF) / TM = (1,000,000 * 4.63) / 20,000 = 231.5
We can round up the result and get a sample size of 232. The exact number as the table approach result.
The Confidence Factor with the Expansion Factor approach
There’s an option if you want a more accurate method than the table approach (AICPA table C-1). You can combine the confidence factor approach with the expansion factor. Here’s the equation.
Sample Size = (Population Size * No Misstatement’s Confidence Factor) / (Tolerable Misstatement – [Expected Misstatement * Expansion Factor])
How do we get the expansion factor? AICPA table C-4 is the answer.
The table requires the Risk of Incorrect Acceptance, which we already have. In our case, the RIA value of 5% gives us an expansion factor of 1.60.
And what is the No Misstatement’s Confidence Factor on the equation?
The equation has a slight difference with the confidence factor approach. Instead of using a confidence factor referenced by the expected misstatement, we will use a confidence factor referenced by the Ratio of Expected to Tolerable Misstatement of zero misstatement.
In our case, using 5% RIA, 0 Ratio of Expected to Tolerable Misstatement, we got 3.00 as a confidence factor.
Before executing the equation, here are our parameters.
- PS = 1,000,000
- No Misstatement’s CF = 3.00
- TM = 20,000
- EM = 4,000
- EF = 1.60
Inputting our numbers into the previous equation, we will have the following result.
Sample Size = (PS * No Misstatement’s CF) / (TM – [EM * EF]) = (1,000,000 * 3.00) / 20,000 – [4,000 * 1.60]) = 220.5
Rounding up the result will get you 221 as the sample size. It’s smaller than the two previous methods, which refer to 232 as the sample size.
AICPA’s Appendix C gives us a couple of pointers about the equation.
- The equation gives the same sample sizes as Table C-1 when no misstatement is expected.
- The equation gives sample sizes smaller than Table C-1 for low to moderate expected misstatements.
- The equation tends to give a larger sample size for higher expected misstatements (40% or more).
- The equation accuracy varies between RIA.
When you expect a worst-case scenario
The worst-case scenario is when you assume that any misstatements identified will be 100% misstatements. This may lead to conservative sample sizes, meaning larger sample sizes are required to achieve the desired level of confidence.
When facing such a challenging situation, you may consult AICPA Table A-1 (for 5% Risk of Overreliance). The table gives you the sample size directly, but you must provide two parameters.
- The Expected Deviation Rate
- Tolerable Deviation Rate
Here are how to calculate the parameters.
Expected Deviation Rate = EM/PS
Tolerable Deviation Rate = TM/PS
For specific examples for this section, we’ll introduce the new parameters to help you navigate AICPA Table A-1.
- PS: 1,000,000
- TM: 20,000
- EM: 5,000
- RIA: 5%
We’ll need to convert the parameters to the two parameters needed by the table.
- Expected Deviation Rate = 5,000/1,000,000 = 0.50%
- Tolerable Deviation Rate = 20,000/1,000,000 = 2%
Navigating AICPA Table A-1 using previous parameters as guidance, we’ll get a 313 sample size.
Common Challenges in Determining Monetary Unit Sampling Sample Size
Knowing the formula is an important thing. However, you’ll often encounter certain challenges when deciding on a sample size. Below are some of the challenges and our proposed solution for the situation.
Lack of Expertise
Our team consists of a range of expertise. You should put your team’s strengths and weaknesses on the “equation”. In fact, Kamau’s findings show that the auditors would pick a smaller sample size when they possess higher audit skills and auditor independence.
Consider doing regular training sessions for the audit team to reduce the challenge.
Resources Availability
Time, personnel, and budget are the common challenges in almost every audit assignment. More samples mean more work (and time and budget). Often, the audit team doesn’t have enough personnel (or time or budget) to perform the work. Some solutions you may consider when facing such a situation are:
- Re-evaluate the Sample Size: Before committing additional resources, it’s essential to ensure that the sample size is necessary. Re-assess all parameters to confirm the sample size is appropriate. Or you could try different methods to determine the sample. As the previous section shows, using the expansion factor approach may reduce the sample size. But you should pick the right method based on the situation given.
- Stratified Sampling: Consider using stratified sampling, dividing the population into subgroups or strata. Doing this lets you focus resources on the strata with higher risks or larger values, potentially reducing the overall sample size.
- Leverage Technology: Use audit software and tools to automate parts of the sampling and testing process. Modern audit software can significantly speed up data extraction, analysis, and documentation tasks.
Conclusion
After obtaining the sample size, you need to choose the sample, perform the substantive test, project the misstatement, and draw a conclusion about the population. Deciding the sample size is crucial in the audit process, especially when the Monetary Unit Sampling is employed because it will give you a reliable and precise audit conclusion.
There are several methods for every audit scenario. We can pick the proper method after considering our situation, which includes the challenges and strengths we have.
I hope this post gives you a clearer comprehension of the Monetary Unit Sampling sample size. And please leave me any comments about your experience, challenges, or solutions you found when doing this audit phase.
Cheers.
